Scientific computing
Computation you can check
A simulation is only as useful as its accuracy is known. PhyAnalytics treats verification, convergence and reproducibility as part of the result.
- 01 /
Numerical simulation
Solving the governing equations of a physical system on a computer: time integration of ordinary differential equations, and discretisation of partial differential equations by finite differences, finite volumes or finite elements.
The field opposite is a steady heat-conduction problem on a square plate: a heated segment on one edge, a warm side, and an internal heat source. The Laplace-type equation is discretised with the five-point stencil on a 60 x 60 grid (3,600 unknowns) and solved directly as a sparse linear system.
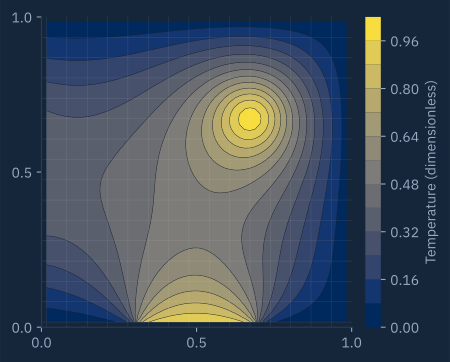
FIG 1Steady temperature field. Five-point finite differences, direct sparse solve; every fourth grid line shown. - 02 /
Numerical analysis
Every method has a theoretical order of accuracy: halve the step size and the error should fall by 2p. Measuring the observed order on problems with known solutions verifies that the code does what the mathematics says.
Opposite, three solvers on test problems with exact solutions. The observed orders are 1.04 for explicit Euler, 2.00 for second-order finite differences, and 3.96 for classical Runge–Kutta, matching the theoretical 1, 2 and 4.
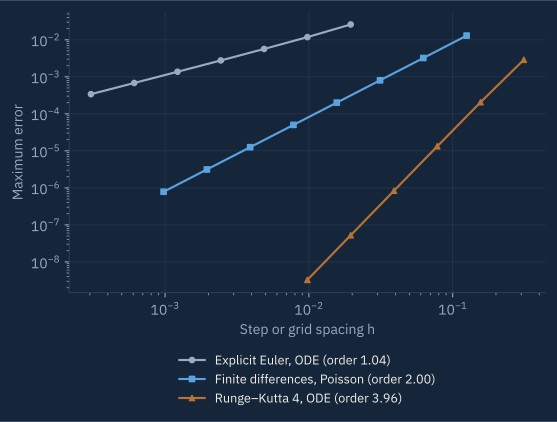
FIG 2Convergence study. Euler and RK4 on a damped oscillator; finite differences on a one-dimensional Poisson problem. - 03 /
Computational modelling
Building simulation codes around physical models: choosing the discretisation, handling stiffness and multiple scales, and structuring code so that parameters can be calibrated and studied systematically. Large parameter studies run in parallel where the problem requires it.
- 04 /
Reproducible workflows
Every figure on this site is generated by code from data, not drawn. Scripts, data sources and random seeds are versioned, so a number on a page can be traced back to the computation that produced it and rerun.
- 05 /
Machine learning and data pipelines
Models depend on data that is collected, cleaned and checked the same way every time. This area covers machine learning for physical and scientific data with its uncertainty stated, and tested, containerised pipelines, scheduled workflows and retrieval-based AI tools, shown through method demonstrations and four proof-of-concept projects.